Use → Initial Ingest Setup
The Job Performance data workflow is run as a series of batch processing scripts executed periodically via cron.
Before setting up the batch processing workflow, we highly recommend manually running the various scripts in debug mode.
All data processing scripts and commands should be run under an unprivileged
user account. For a typical installation the xdmod user account is recommended
since this will have the necessary access permissions to the XDMoD configuration
files.
Prerequisites
The following software components should have been installed and configured:
- PCP running on compute nodes
- XDMoD with the Job Performance (SUPReMM) module
- MongoDB
- Job Summarization software
The following data should be present:
- XDMoD should have accounting data in the Jobs realm
- PCP archives that contain metrics collected from compute nodes that ran jobs that are present in XDMoD
Manual run
The following steps should be performed in order:
- Ingest job accounting data into XDMoD
- Run the PCP archive indexer script
- Run the job summarization script
- [Optional] Ingest the job batch scripts
- Run the XDMoD ingest and aggregation script
- Verify data in the XDMoD UI
1. Ingest job accounting data into XDMoD
Ensure that there is job accounting data in XDMoD that covers the time period of the PCP archives. For example you can check the ‘Number of Jobs Ended’ metric in the Usage tab of the XDMoD UI and confirm that there are jobs for the same time period as the PCP archive data.
2. Run the PCP archive indexer script
The archive indexer script scans the PCP archive directory, parses each PCP archive and stores the archive metadata in the XDMoD datawarehouse. This index is then used by the job summarization script to efficiently obtain the list of archives for each job.
The archive indexer script uses the archive file path to estimate the create time of each archive. The script will only process archives created in the previous 3 days by default. The first time the archive indexer is run, specify the “-a” flag to get it to processes all archives. It is also recommended to specify the debug output flag -d so that you can see that it is processing the files:
$ indexarchives.py -a -d
A typical output of the script would be:
2018-09-06T11:56:30.066 [DEBUG] Using config file /etc/supremm/config.json
2018-09-06T11:56:30.068 [INFO] archive indexer starting
2018-09-06T11:56:31.433 [INFO] Processed 1 of 1649 (hosttime 0.00125503540039, listdirtime 0.0011420249939, yieldtime 0.0) total 0.00125503540039 estimated completion 2018-09-06 11:56:33.501839
2018-09-06T11:56:31.514 [DEBUG] processed archive /data/pcp-archives/hostname1.example.com/2018/09/04/20180904.00.10.index (fileio 0.067507982254, dbacins 9.67979431152e-05)
2018-09-06T11:56:31.596 [DEBUG] processed archive /data/pcp-archives/hostname1.example.com/2018/09/05/20180905.00.10.index (fileio 0.0788278579712, dbacins 3.19480895996e-05)
2018-09-06T11:56:31.652 [DEBUG] processed archive /data/pcp-archives/hostname1.example.com/2018/09/06/20180906.00.10.index (fileio 0.0517160892487, dbacins 3.09944152832e-05)
...
Verify that the output lists the PCP archives that you expect.
If you see message similar to:
2018-08-21T05:56:27.426 [DEBUG] Ignoring archive for host "login-a" because there are no jobs in the XDMoD datawarehouse that ran on this host.
This means that the PCP archives for this host were skipped and will not be
used for job summarization. If you see the hostname for a compute node that
should have run jobs then the likely cause is that the job data was not ingested
into XDMoD. Go back ingest the job data and then rerun the indexarchives.py -a command again.
3. Run the summarization script:
The summarization script is responsible for generating the job level summary records and inserting them in the MongoDB instance. The script reads the job information from the XDMoD datawarehouse and processes the PCP archives. The default behavior of the script is to process all jobs in the XDMoD datawarehouse that have not previously been summarized. If there are no PCP archive data for a job then a summary record is still created, but, of course, there will be no performance metric information in the record.
$ summarize_jobs.py -d
You should see log messages indicating that the jobs are being processed. You can hit CTRL-C to stop the process. The jobs that have been summarized by the script will be marked as processed in the database and the summaries should end up in MongoDB. Check to see that the summaries are in MongoDB by, for example, using the MongoDB command line client to query the database:
$ mongo [MONGO CONNECTION URI]
> var cols = db.getCollectionNames();
> for(var i=0; i < cols.length; i++) {
      print(cols[i], db[cols[i]].count())
  }
4. [Optional] Run the job batch script ingest
Job batch scripts are displayed in the “Job Script” tab in the “Job Viewer” in XDMoD. This tab is only displayed if the job script is available and the absence of the jobs scripts does not impact the rest of the interface.
The ingest_jobscripts.py script parses the filesystem, reads each job script file
and loads the contents into the XDMoD datawarehouse.
If you have the batch scripts for each HPC job available, they are ingested as
follows
$ ingest_jobscripts.py -a -d
The ingest_jobscripts.py has similar commandline configuration as the indexarchives.py. The path
is parsed to obtain the start time of the job and only the last 3 days worth of
jobs are ingested by default.
5. Run the XDMoD ingest and aggregation script
Once there are job summary data in MongoDB it is ingested and aggregated into
XDMoD by running the following command as the xdmod user on the XDMoD host:
$ aggregate_supremm.sh -d
This script runs three separate commands. First the job summary data is ingested from MongoDB to the XDMoD datawarehouse. Then a script parses the job accounting data and records which jobs shared compute nodes. Then the data are aggregated to be displayed in the XDMoD UI.
The ingestion and aggregation software automatically processes all job summaries
that have not previously been processed. The shared jobs calculation by default
processes jobs that ran over the previous three days. If there are jobs
that shared compute nodes that are older than this three day window then
run the shared jobs script with the -a flag to process all jobs in the database:
$ /usr/lib64/xdmod/supremm_sharedjobs.php -a -d
$ aggregate_supremm.sh -d
This commands should be run as the xdmod user on the XDMoD host.
It is not necessary to run the supremm_sharedjobs.php with the -a flag every
time, only on initial ingest if there are older jobs.
6. Check Open XDMoD Portal
After the XDMoD ingest and aggregation script has completed successfully you should log in to the portal and confirm that the data are present.
The Job Performance data is displayed in the ‘SUPREMM’ realm in XDMoD. There are access controls enabled on the data as follows:
- Accounts with ‘User’ role may only see job performance data for jobs that they ran;
- Accounts with ‘Principal Investigator’ role may only see job performance data for their jobs and the job that they were PI on;
- Accounts with ‘Center Staff’ and ‘Center Director’ role may see all jobs.
You should login using an account that has either ‘Center Staff’ or ‘Center Director’ role and confirm that there is an additional tab visible named “Job Viewer”. In addition to the new tab, the “SUPREMM” realm should be visible in the “Usage” and “Metric Explorer” tabs.
If there were jobs in the database then there should be data for the ‘Number of Jobs Ended’ metric. If there were valid metrics then you should see data for the ‘Avg CPU %: User metric’.
Note that the admin user that was created in the Open XDMoD has a ‘User’ role mapped to the ‘Unknown’ user by default. This means that all plots of SUPREMM realm data will show “No data available for the criteria specified” and no jobs will be able to be viewed in the “Job Viewer” tab. The ‘Center Director’ role may be added to the admin user account via the Internal Dashboard.
Troubleshooting
The administrator internal dashboard has a ‘SUPReMM Dataflow’ tab that shows the data flow information for each configured resource. The internal dashboard is available using the “Dashboard” button on the top toolbar in the XDMoD UI for user accounts that have the ‘Manager’ role. An example of the dataflow diagram is shown in Figure 1. below.
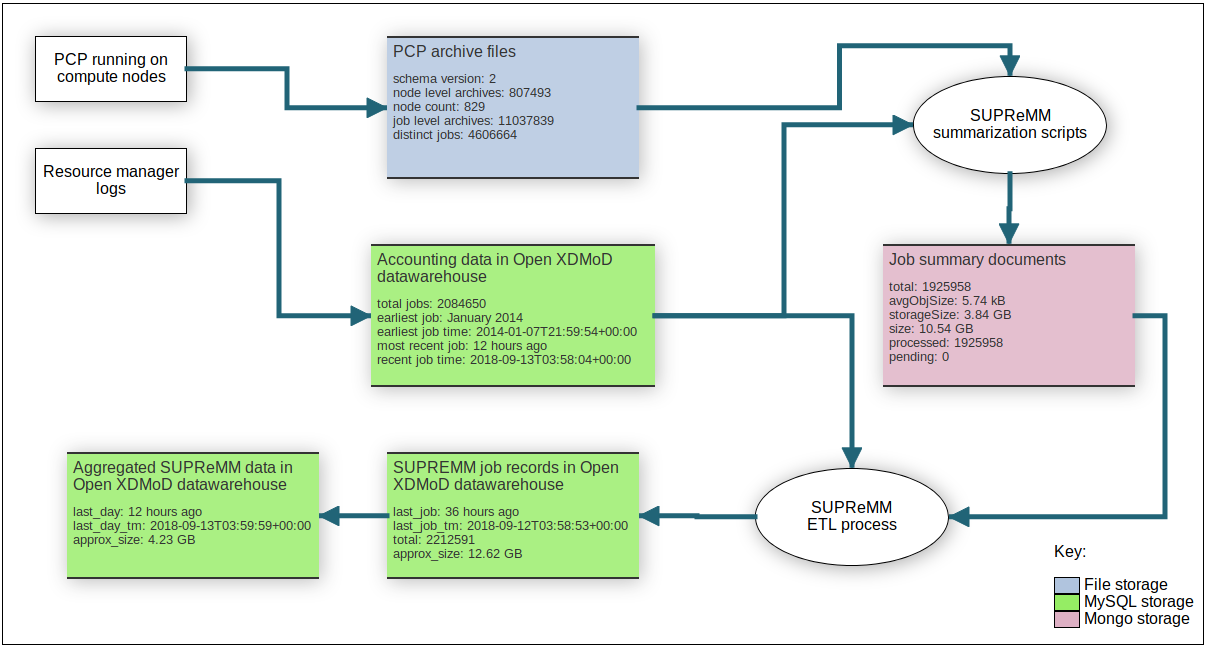
Figure 1. Example screenshot of the dataflow diagram in the XDMoD internal dashboard. The dataflow diagram displays detailed statistics on the data stored at various points in the processing workflow.
The data flow page shows information for each configured HPC resource separately. Use the dropdown on the top left to select each resource and check that the statistics reported in each of the blocks are as expected.
PCP archive files
The ‘node count’ metric should match the number of distinct compute nodes with PCP data
stored on the filesystem.
The ‘node level archives’ metric should match the number of node level archives. If these
do not match up then rerun the indexarchives.py script following the instructions
in Step 2.
Job summary documents
The ‘total’ metric indicates the total number of job summaries stored in the MongoDB instance. These
are generated by the summarize_jobs.py script described in
Step 3.
The ‘processed’ count indicates the number of jobs that have been successfully ingested
into the XDMoD datawarehouse. If the ‘pending’ count is non-zero (and the processed
job count is non-zero) then the job data needs to be ingested into XDMoD following the instructions
in Step 5.
SUPREMM job records in Open XDMoD datawarehouse
The ‘total’ metric indicates the total number of job records ingested into XDMoD from MongoDB. If this value is less than the number of jobs in MongoDB then the job data needs to be ingested into XDMoD following the instructions in Step 5.
Advanced troubleshooting
The recommended strategy for advanced troubleshooting is to identify an HPC job that
- Has accounting data present in the XDMoD datawarehouse
- Has PCP archive data for the compute nodes on which the job ran
- Had a wall time long enough for multiple data points to be recorded. For example if you have setup a 30 second collection period, then choose a job that ran for at least ten minutes.
The information about this job should be manually traced though each step in the dataflow. The
xdmod-supremm-jobinfo script provides low-level debug information about a given job
by directly querying the XDMoD datawarehouse and MongoDB.
/usr/lib64/xdmod/xdmod-supremm-jobinfo -r RESOURCE -j JOBID
An example output of this script for a job that has all data present and correct is shown below:
$ ./xdmod-supremm-jobinfo -r resourcename -j 8038957
Job 8038957 (end time 2018-01-01 16:40:50)
Host list (1 hosts):
    "compute-15-33"
Archive list:
    Host "compute-d15-33"
      "/data/pcp-logs/compute-d15-33/2018/01/01/20180101.00.10"
      "/data/pcp-logs/compute-d15-33/2018/01/01/job-8038957-begin-20180101.03.46.33"
      "/data/pcp-logs/compute-d15-33/2018/01/01/job-8038957-end-20180101.16.40.50"


Data from modw_supremm:
    13 8038957 1514842850
Summary in mongo: _id, summarization, procDump, process_memory, infiniband, cpuperf, gpfs, cpu, network, cores, nfs, uncperf, memory, load1, acct, catastrophe, block, nodememory, processed
Summary in mongo: _id, lnet, memused, cpuuser, ib_lnet, version, nfs, simdins, process_mem_usage, hosts, membw, memused_minus_diskcache, block