About → Overview
The Job Performance (SUPReMM) module provides a wide range of job performance information including memory usage, filesystem usage, interconnect fabric traffic, and CPU and GPU performance. XDMoD supports performance data ingestion from a variety of open-source tools including PCP, Prometheus, and HPCPerfStats. The large variety of job performance metrics gives computing center directors, support personnel, and researchers insight into the performance of jobs running on the cluster.
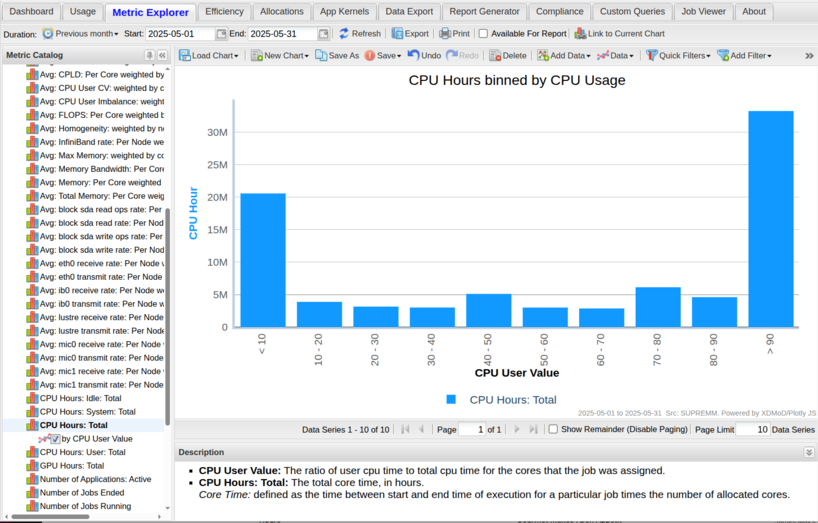
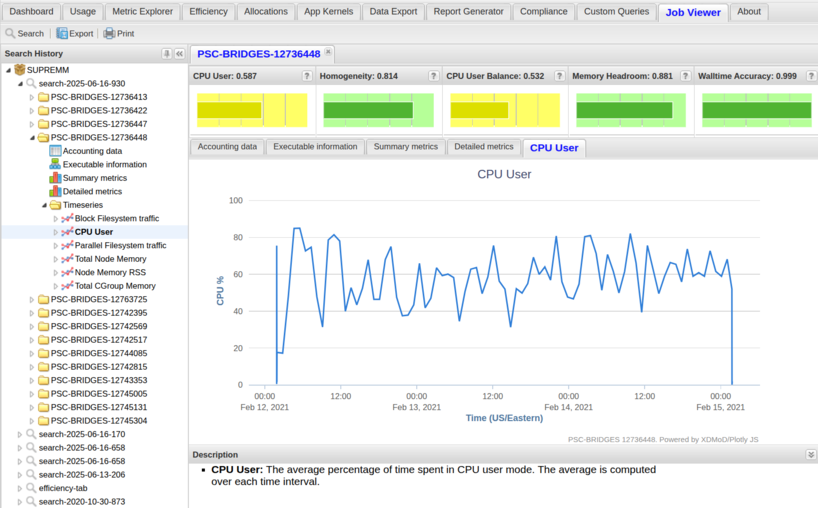
Along with providing cluster wide information as shown in Figure 1, the Job Performance module provides detailed information about individual jobs such as CPU usage, Memory usage, and I/O usage through the Job Viewer tab, as shown in Figure 2. Users can see information about their jobs in this tab allowing them to troubleshoot their jobs.
The Job Performance module also provides job efficiency information on the Efficiency tab which displays information about the efficiency of jobs running on the resources at your center. The information includes CPU Usage, GPU Usage, Memory Usage, Homogeneity, Wall Time Accuracy, and Short Jobs. More information about the Efficiency tab can be seen on the Job Efficiency Tab documentation page.
If you are intending to do a fresh install of the software then the starting point is to review the Software licensing information, read the Architecture guide and the Install overview.
The Upgrade Overview is the starting point for an upgrade of an existing instance.