Advanced Usage → Job Efficiency Tab
This document describes how to customize the help text displayed when viewing the analytics in the Efficiency Tab and remove any analytics that are not pertinent to your center. These instructions are intended for a system administrator of an Open XDMoD instance. Information about the use of the efficiency tab can be found in the user manual which is available from the “Help” menu on the top right of the XDMoD portal.
Efficiency Analytics
The efficiency analytics are shown when you first navigate to the efficiency tab. With each analytic, there is associated text explaining what the analytic is, what is considered inefficient in regard to the analytic, and supporting text giving suggestions of how to improve efficiency regarding a specific analytic.
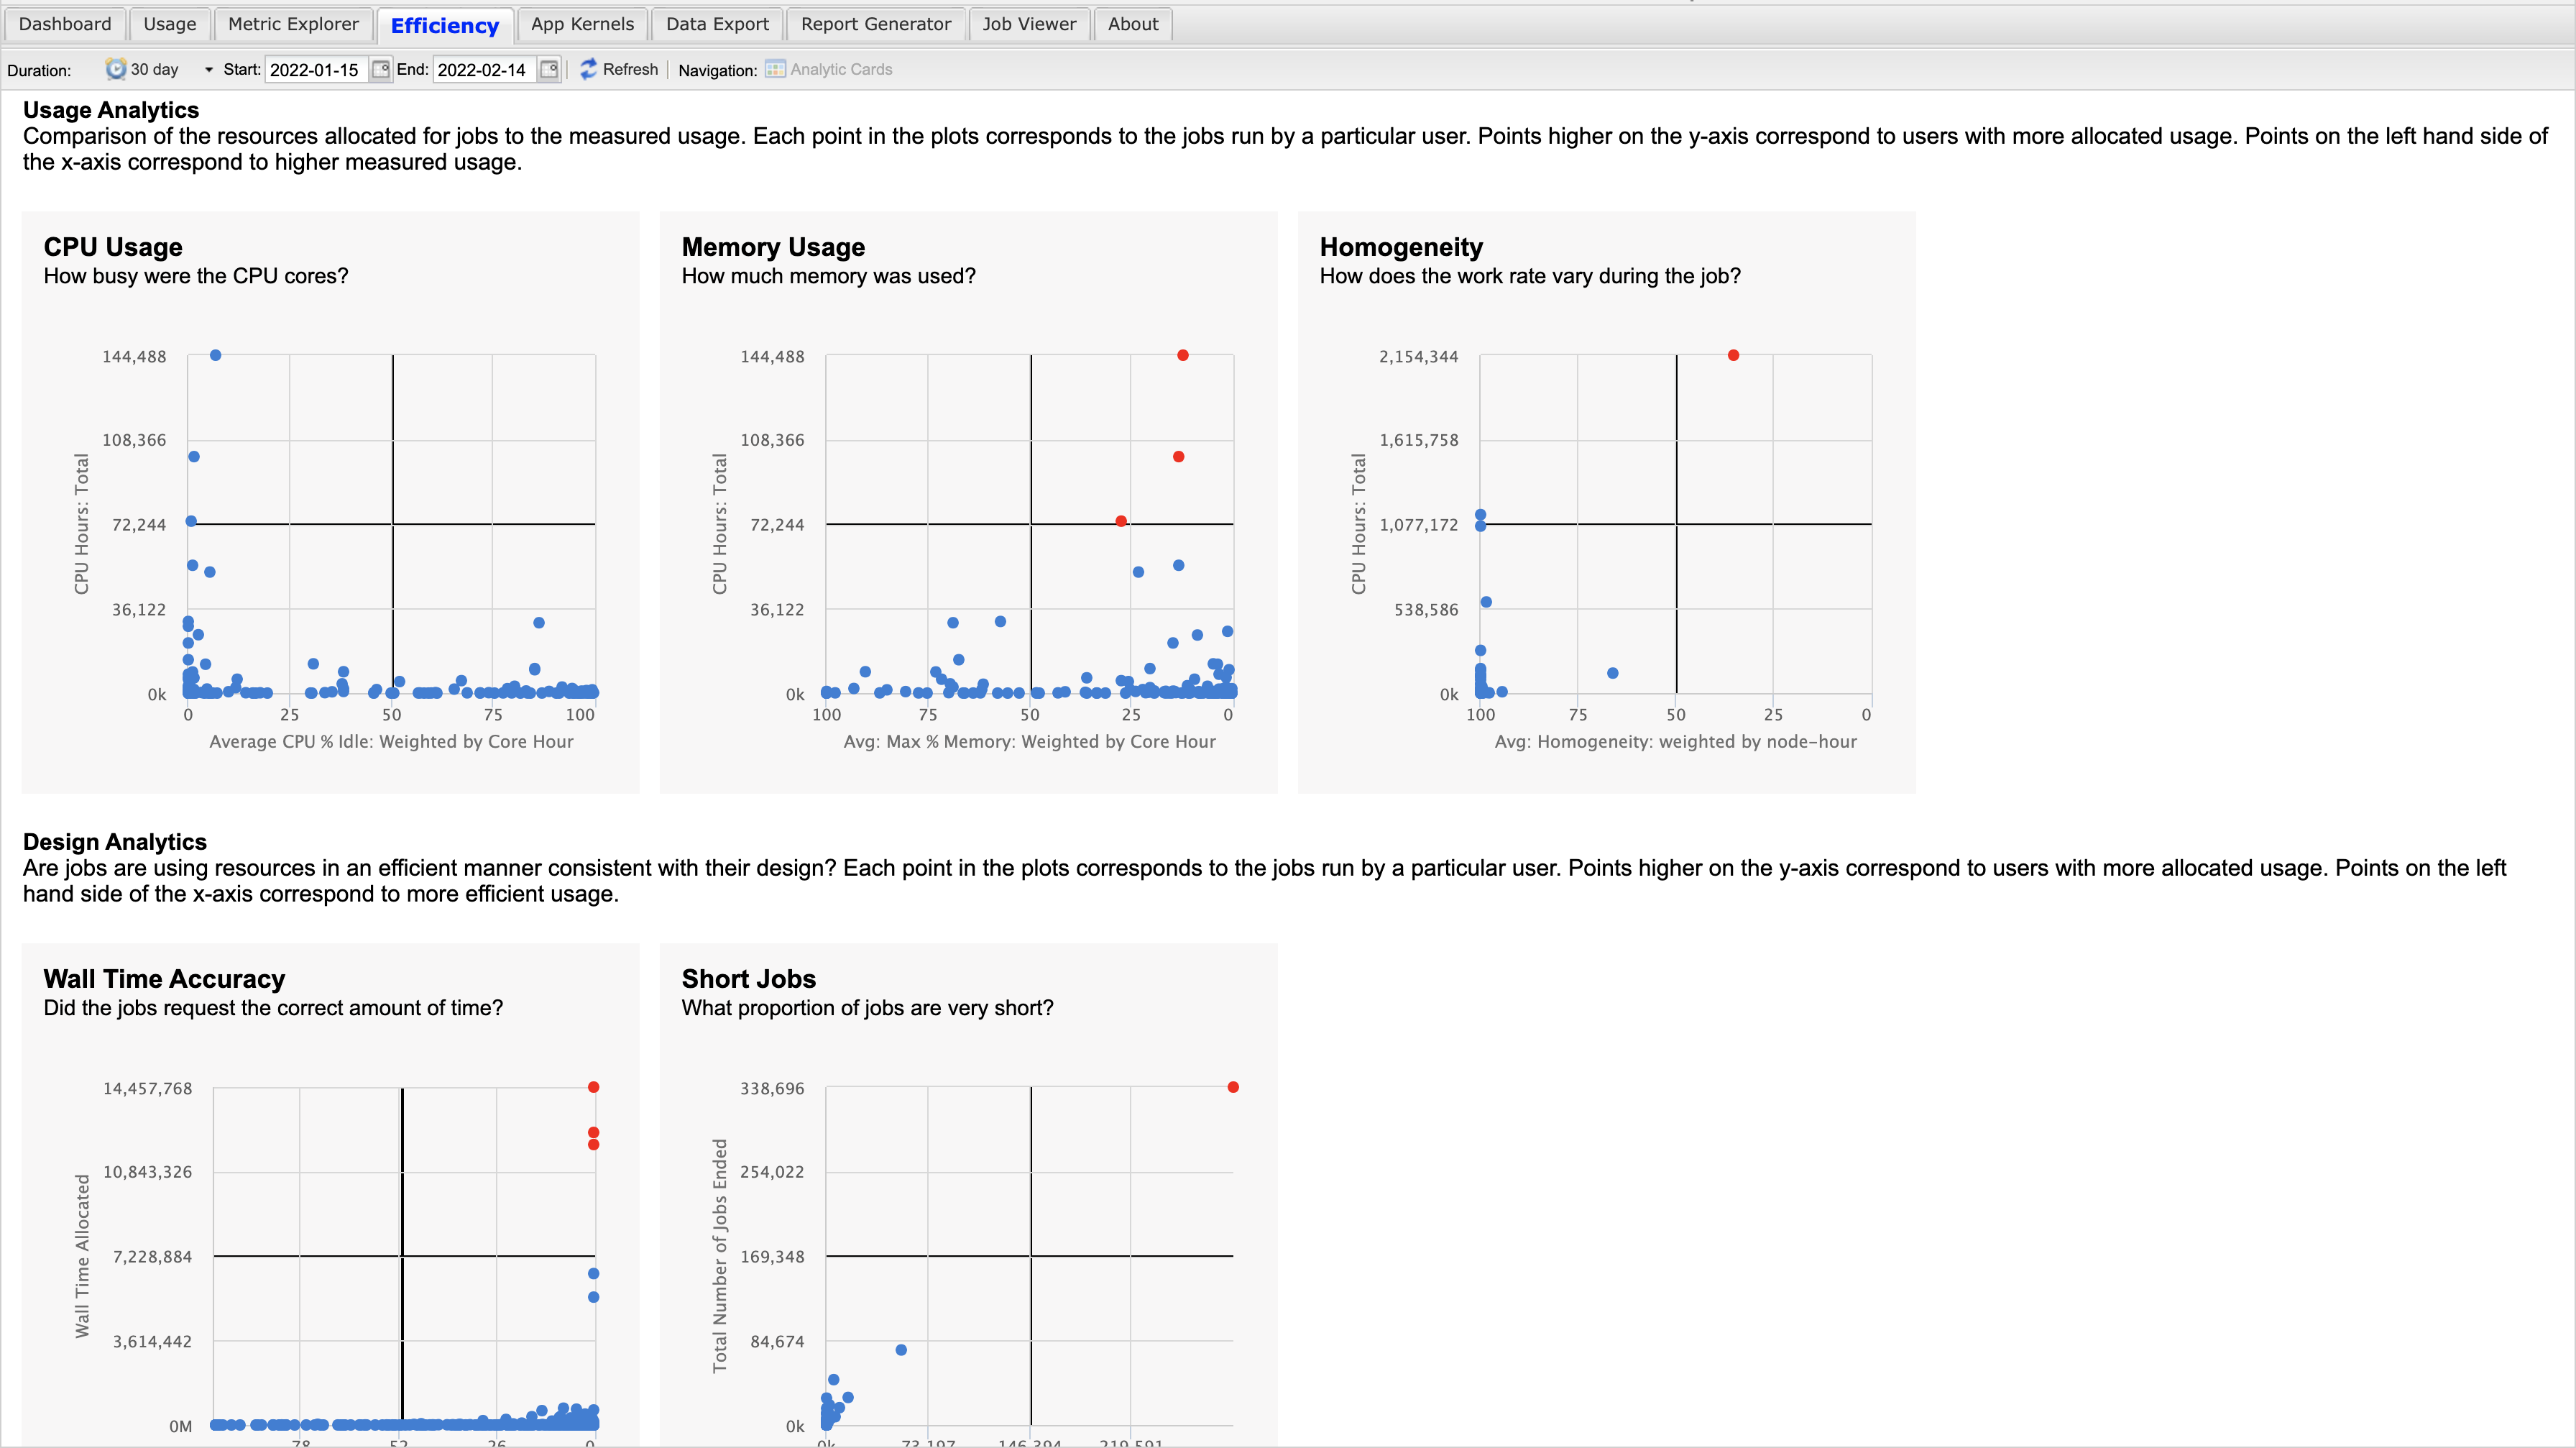
As of the 10.0 release, there are six analytics. These are CPU Usage, GPU Usage, Memory Usage, Homogeneity, Wall Time Accuracy, and Short Jobs. When you first navigate to the efficiency tab, you will see cards each representing an analytic. Each card includes a brief description of the analytic as well as a scatter plot that allows you to visualize how users rank in each analytic (see Figure 1 below).
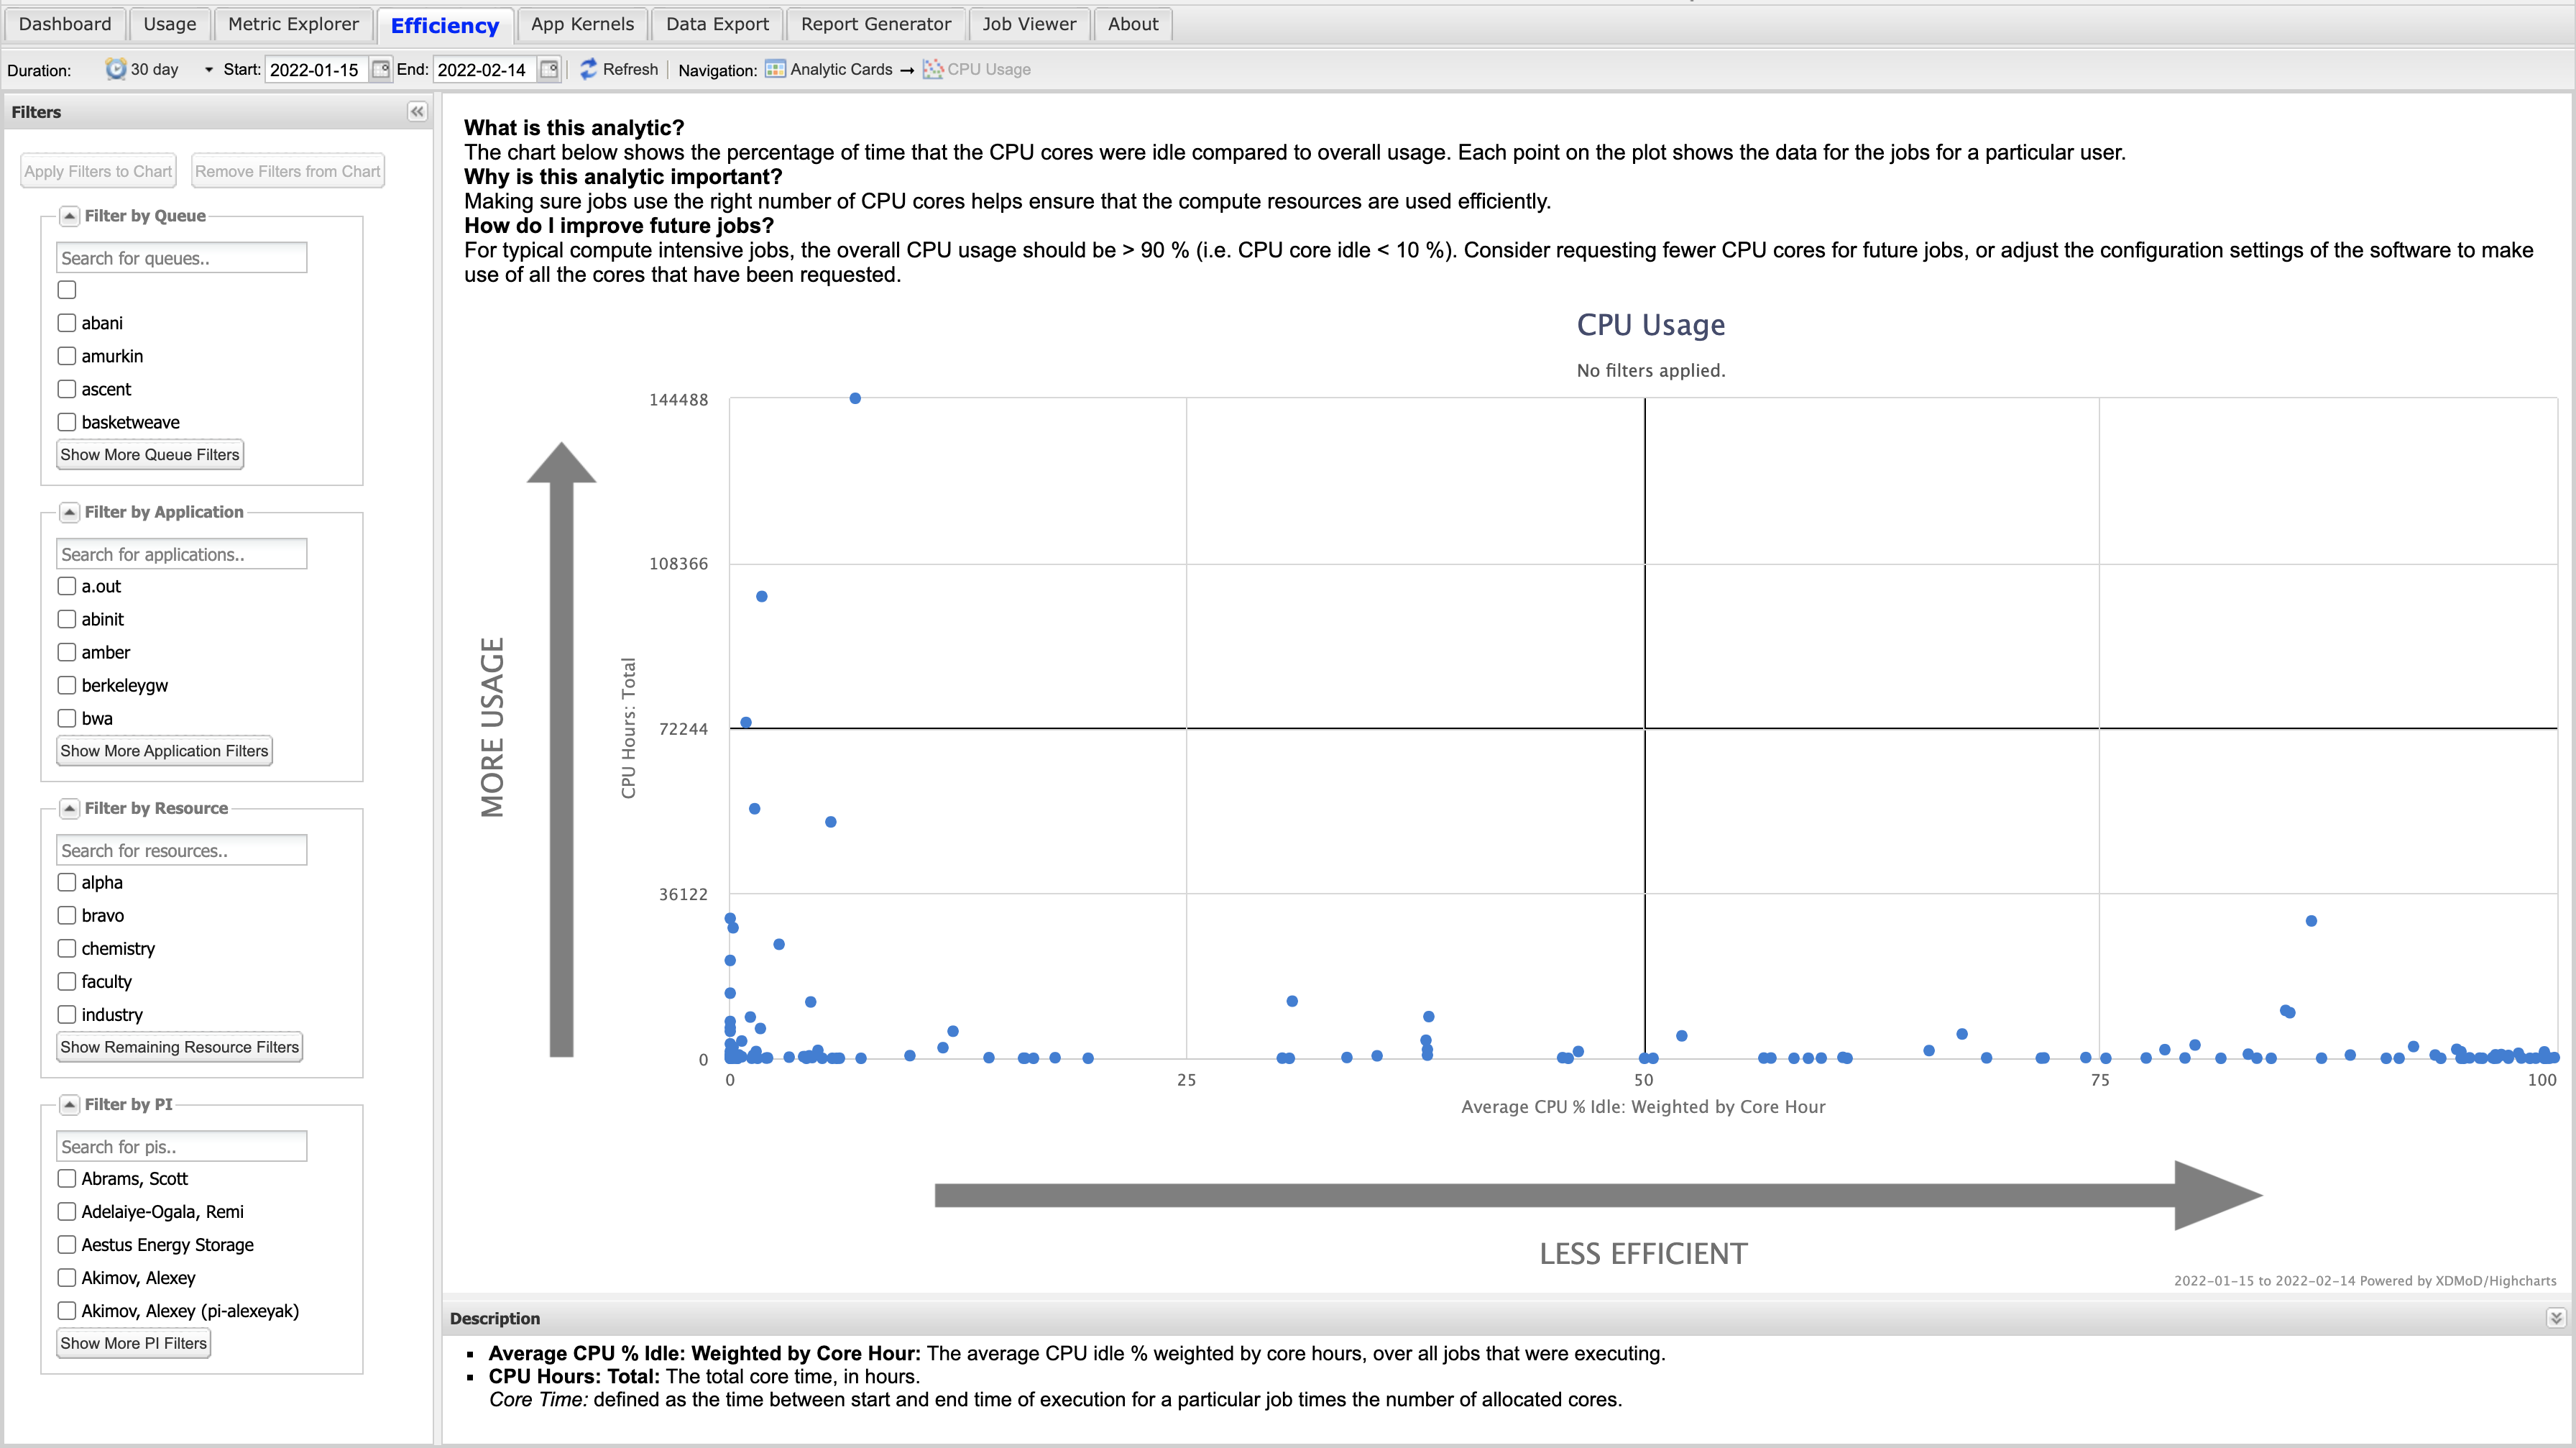
Upon clicking on one of the analytic cards, a user will be shown a larger view of the scatter plot that they can interact with by filtering or drilling down. In this view, more text is presented to give more information about the specific analytic and how efficiency may be improved for that analytic. Figure 2 below shows this view for CPU Usage. In this image, you can see the help text at the top of the image above the scatter plot. The associated help text shown in this view can be customized as needed for different centers.
You may want to customize this text to provide more focused feedback for users at your center or provide links to help text as appropriate. To do so, please follow the directions provided below.
These instructions only apply to Open XDMoD 10.0. For later versions please refer to the documentation for that release.
To customize text for an analytic you need to edit the /etc/xdmod/efficiency_analytics.json configuration file. For example, to edit the help text for the CPU Usage scatter plot you would edit the html that is under “documentation” in lines 28-37. To edit the help text for the CPU Usage histogram, you would edit the html that is under “histogramHelpText” in lines 46-55. The lines to edit for each are shown below.
28 "documentation": [
39 "<div class='text'>",
30 "<h6> What is this analytic? </h6>",
31 "<p>The chart below shows the percentage of time that the CPU cores were idle compared to overall usage. Each point on the plot shows the data for the jobs for a particular user.</p>",
32 "<h6> Why is this analytic important? </h6>",
33 "<p>Making sure jobs use the right number of CPU cores helps ensure that the compute resources are used efficiently.</p>",
34 "<h6> How do I improve future jobs? </h6>",
35 "<p>For typical compute intensive jobs, the overall CPU usage should be > 90 % (i.e. CPU core idle < 10 %). Consider requesting fewer CPU cores for future jobs, or adjust the configuration settings of the software to make use of all the cores that have been requested.</p>",
36 "</div>"
37 ],
46 "histogramHelpText": [
47 "<div class='text'>",
48 "<h6> What is this analytic? </h6>",
49 "<p>The chart below shows the percentage of time that the CPU cores were idle compared to overall usage.</p>",
50 "<h6> Why is this analytic important? </h6>",
51 "<p>Making sure jobs use the right number of CPU cores helps ensure that the compute resources are used efficiently.</p>",
52 "<h6> How do I improve future jobs? </h6>",
53 "<p>For typical compute intensive jobs, the overall CPU usage should be > 90 % (i.e. CPU core idle < 10 %). Consider requesting fewer CPU cores for future jobs, or adjust the configuration settings of the software to make use of all the cores that have been requested.</p>",
54 "</div>"
55 ]
For editing help text for other analytics, the process is the same, but you need to change the “documentation” that corresponds to that specific analytic. Not all analytics include alternative help text for the histogram view. If you want to include this text, add in the histogramHelpText section under the histogram json for the analytic that you are interested in changing. If you want to exclude this text, remove the histogramHelpText section from the histogram json for that specific analytic.
In addition to editing the help text, you can also remove an analytic if it is not pertinent to your center. To do this, you need to remove the analytic from the /etc/xdmod/efficiency_analytics.json configuration file. For example, to remove GPU Usage from showing in the XDMoD interface, you would remove lines 58-109 from this file. The lines to remove are shown below.
58      {
59              "analytic": "GPU Usage",
60              "description": "How busy were the GPU cores for GPU jobs?",
61              "title": "GPU Usage",
62              "field": "avg_percent_gpu_active",
63              "statistics": [
64                  "avg_percent_gpu_active",
65                  "gpu_time"
66              ],
67              "statisticLabels": [
68                  "Avg GPU % Active: Weighted by GPU Hour",
69                  "GPU Hours: Total"
70              ],
71              "statisticDescription":  [
72                  "<ul><li><b>Avg GPU active: weighted by gpu-hour: </b> The average GPU usage % weighted by gpu hours, over all jobs that were executing.</li></ul><ul><li><b>GPU Hours: Total</b> The total GPU time in hours for all jobs that were executing during the time period. The GPU time is calculated as the number of allocated GPU devices multiplied by the wall time of the job.</li></ul>"
73              ],
74              "valueLabels": [
75                  "%",
76                  "GPU Hours"
77               ],
78              "reversed": true,
79              "realm": "SUPREMM",
80              "documentation": [
81                      "<div class='text'>",
82                      "<h6> What is this analytic? </h6>",
83                      "<p>The chart below shows the percentage of time that the GPUs were busy compared to overall usage. Each point on the plot shows the GPU jobs for a particular user.</p>"
84                      "<h6> Why is this analytic important? </h6>",
85                      "<p>Making sure jobs use the right number of GPUs helps ensure that the compute resources are used efficiently.</p>",
86                      "<h6> How do I improve future jobs? </h6>",
87                      "<p>Try to ensure that the number of GPUs requested matches the number required. If a code is not using all GPUs adjust the configuration settings of the software to make use of all the requested GPUs or consider requesting fewer GPUs in future jobs. If you have jobs with 0% GPU usage, double check that the code is compiled correctly to make use of the GPUs and is not defaulting to CPU-only calculations.</p>",
88                      "</div>"
89              ],
90              "histogram": {
91                      "title": "GPU Usage",
92                      "metric": "gpu_time",
93                      "metricTitle": "GPU Hours Total",
94                      "group_by" : "gpu_usage_bucketid",
95                      "groupByTitle": "GPU Active Value",
96                      "rotate": true,
97                      "arrowImg": "right_arrow.png",
98                      "histogramHelpText": [
99                              "<div class='text'>",
100                             "<h6> What is this analytic? </h6>",
101                             "<p>The chart below shows the percentage of time that the GPUs were busy compared to overall usage.</p>",
102                             "<h6> Why is this analytic important? </h6>",
103                             "<p>Making sure jobs use the right number of GPUs helps ensure that the compute resources are used efficiently.</p>",
104                             "<h6> How do I improve future jobs? </h6>",
105                             "<p>Try to ensure that the number of GPUs requested matches the number required. If a code is not using all GPUs adjust the configuration settings of the software to make use of all the requested GPUs or consider requesting fewer GPUs in future jobs. If you have jobs with 0% GPU usage, double check that the code is compiled correctly to make use of the GPUs and is not defaulting to CPU-only calculations.</p>",
106                             "</div>"
107                     ]
108             }
109     },
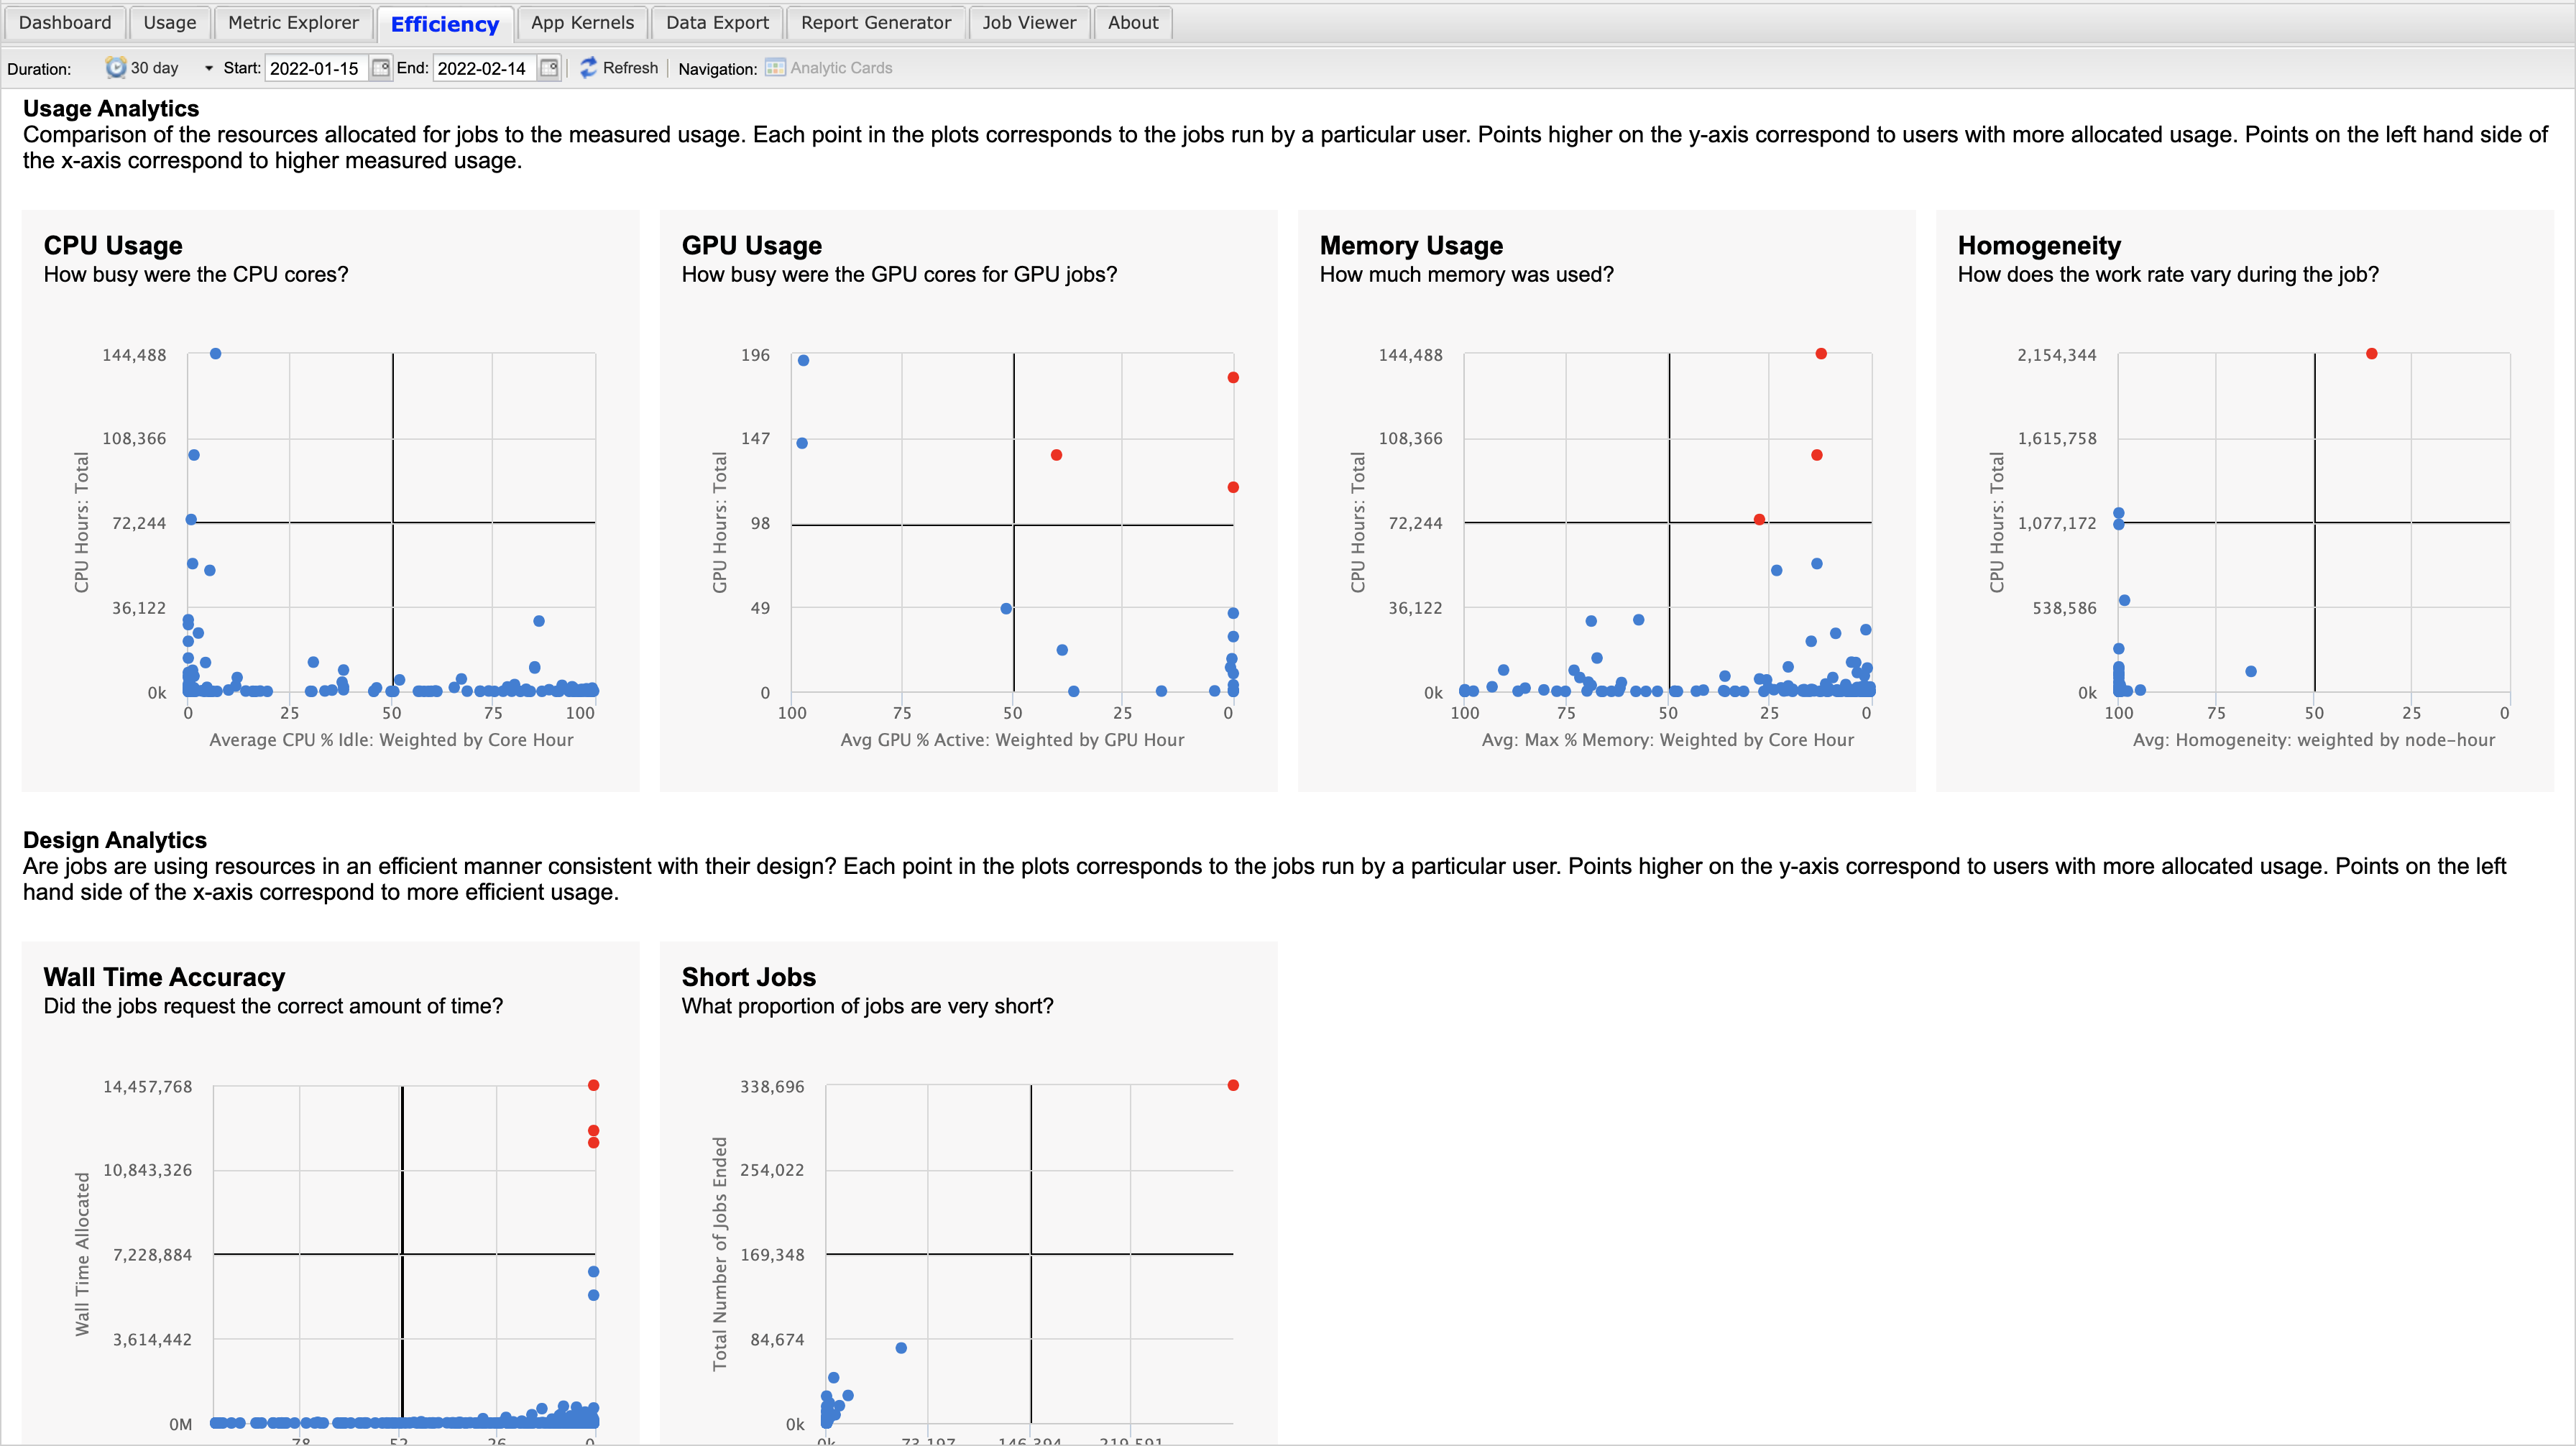
Figure 3 below shows an example of what the updated efficiency tab interface would look like if you were to remove GPU Usage.